Contents
Problems with Chart.js
At my job, I was working on a project that required charting some data. I started, naively, with the first good looking JavaScript plugin. Chart.js, fancy, modern, easy to integrate, works well. However, as always, the scope was more than I could initially imagine. The size of the data was larger than I initially anticipated.
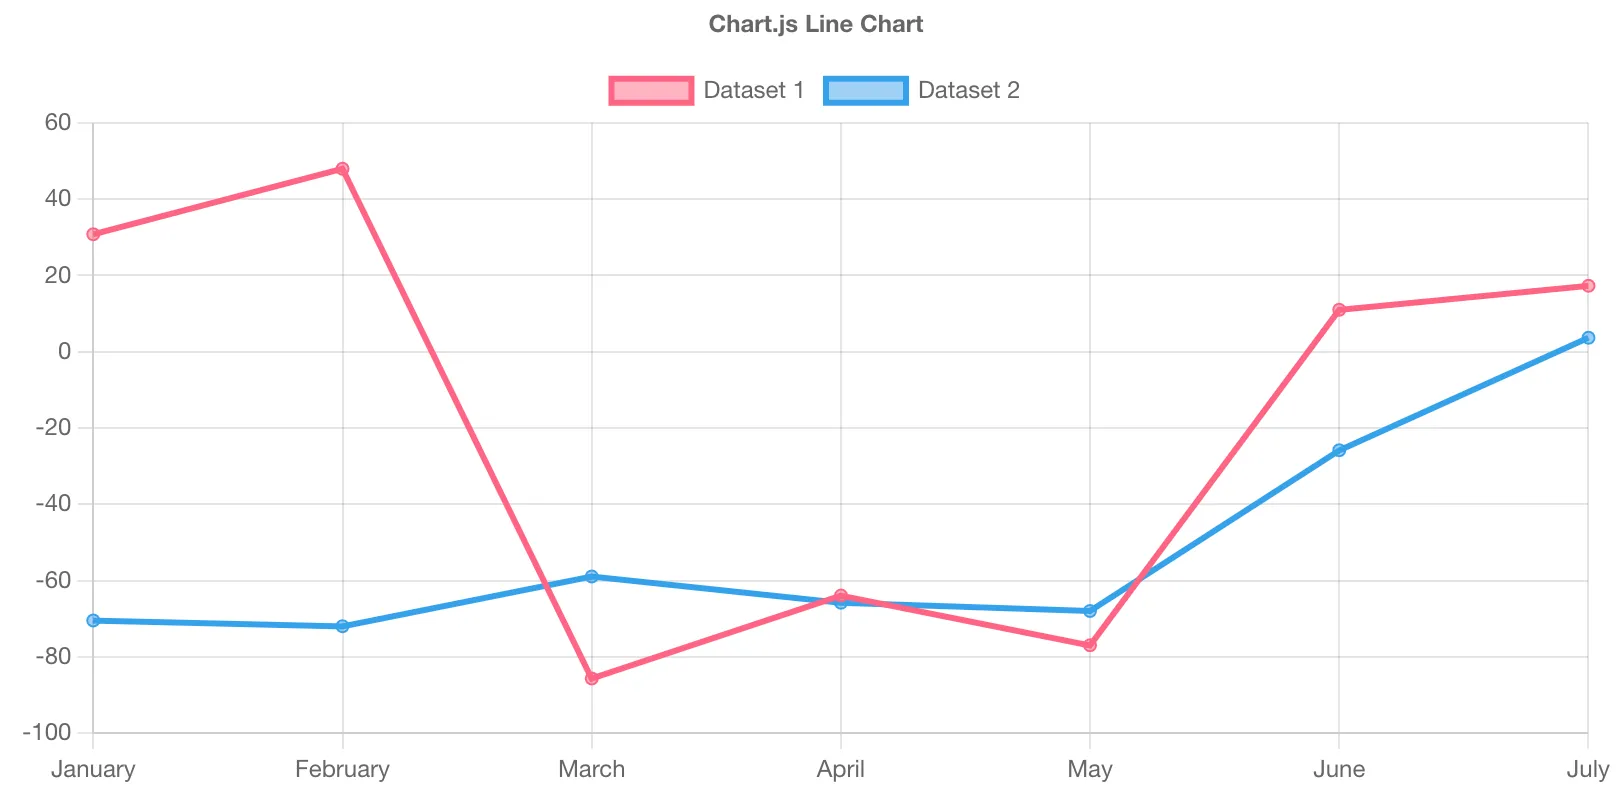
Chart.js is pretty cool, and very pretty, however that prettiness can also be it’s downfall. All the eye candy can slow down the rendering, most of this can be disabled, but then you end up with a very not interactive chart. After going through a vast number of them1. I found an open-source project called uPlot. It looked awesome. It also came with a reference to an interesting article: “Stacked Area Graphs Are Not Your Friend”, which is an interesting read. To me this is a good sign when evaluating a dependency since it means the author has a passion in what they’re writing.

You can see in this lovely image from the uPlot README that Chart.js uses more resources when rendering. Funnily enough, it’s actually shown to be the second most performant in a lot of metrics. I will freely admit that potentially I did not look that hard into optimising the Chart.js performance. Once I realised that we would be looking at very large datasets I basically immediately went to look for the fastest library I could find.
So after half a day rebuilding the chart with this library:
Hallelujah! High performance charting with large datasets2. It was happy days from then on…
Streaming Data
Scope always creeps, and the code that was powering this charting library that displays static data was now needed to display live data.
Well I think, there are demos for this, slap that together and look at that streaming in data.
Looks pretty slick right? (That was a joke, this test data is just noise…) Well it works well on my M2 Max chip. But I was getting reports that it was going pretty slowly on some other computers. So I found one that could replicate, took a profile:
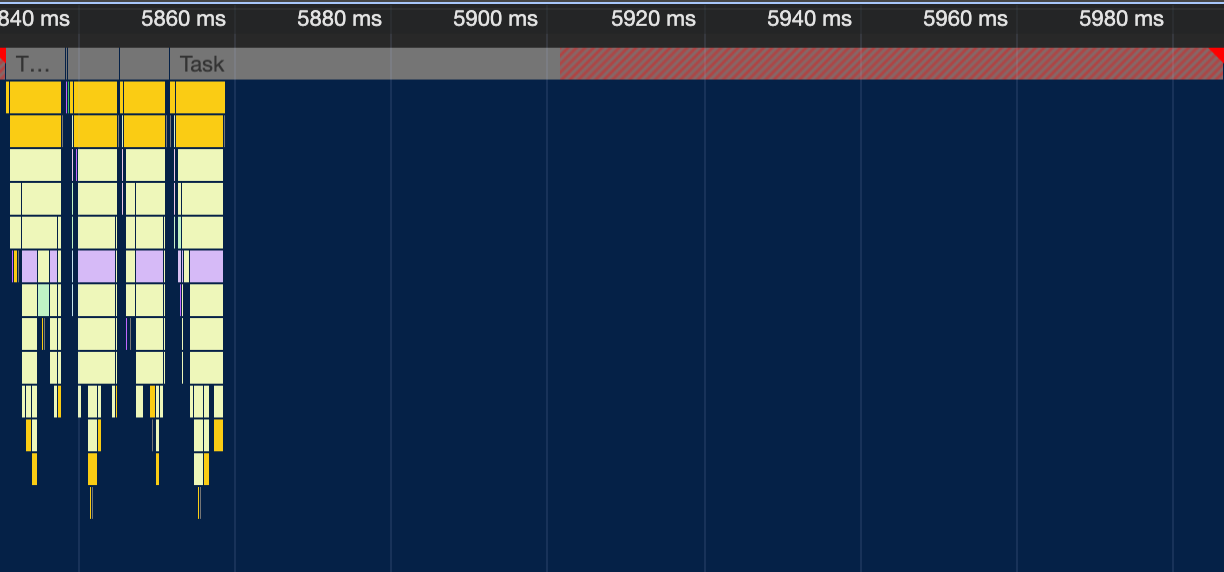
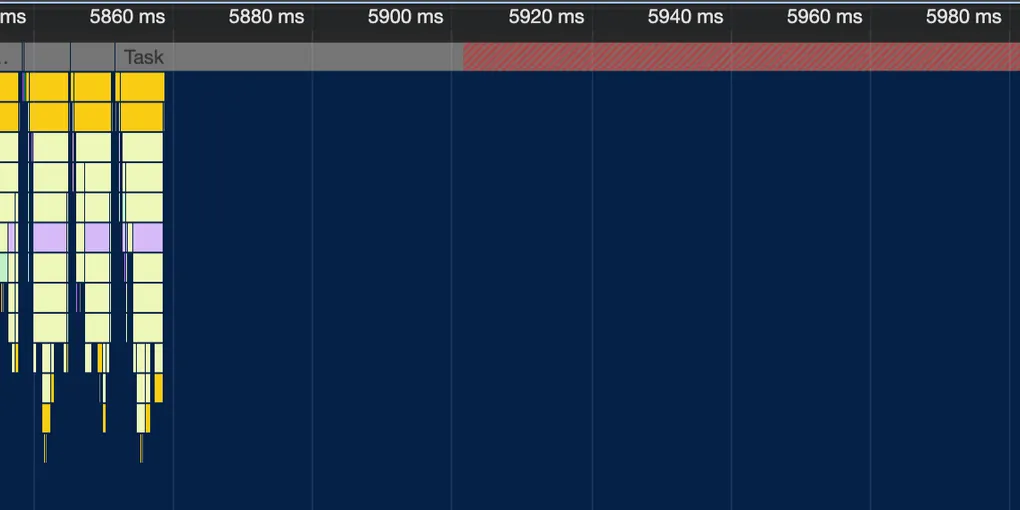
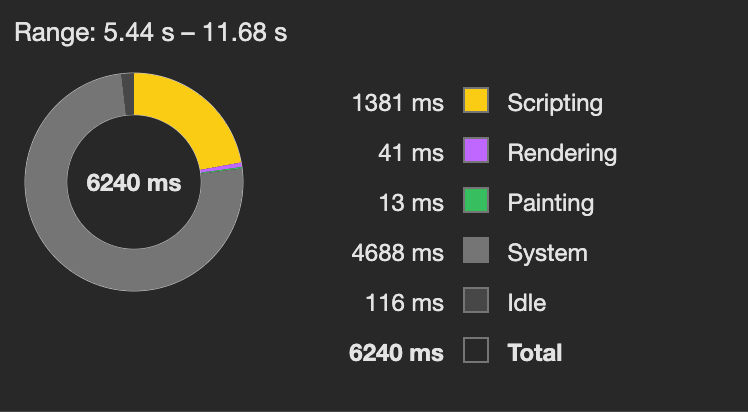
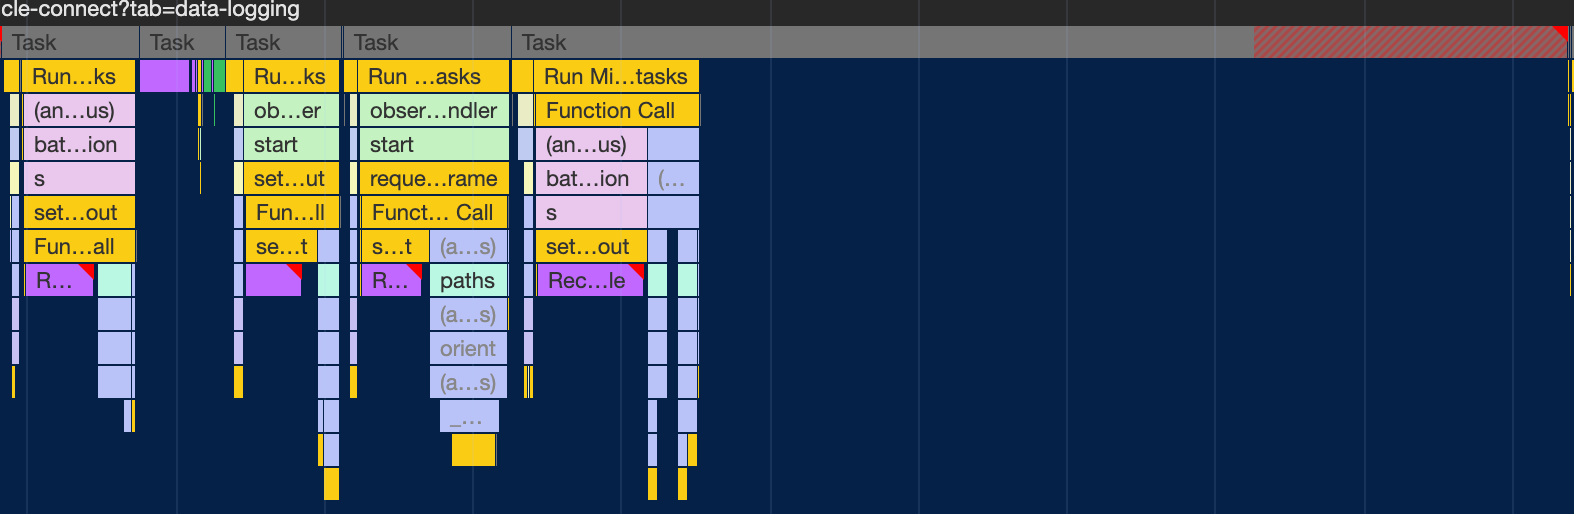
Zooming into that one chunk that’s doing something:
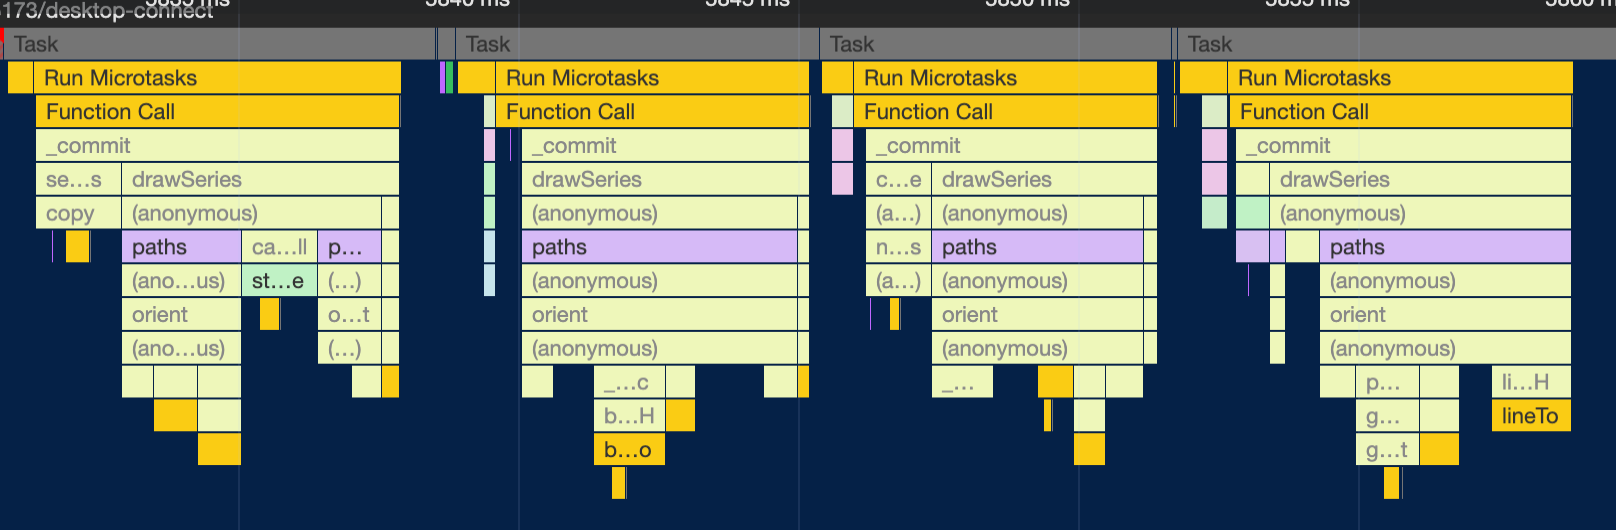
So where’s the issue? It’s clearly doing the work, primarily spending time building paths for the plot. This stumped me for a bit. 80% of the time is spent on literally nothing! It’s just an empty task that’s going for too long. This was really confusing, but the hint came here:
What’s that? 75% of the time is being used by ‘system’. First result on Google is this. Which if you follow that down basically tells you that it’s, computer things… Anything that’s not specifically profiled, which is not helpful. Well off to task manager to see what the computers doing.
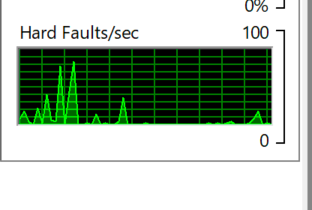
This was during the data streaming of the chart. That’s a lot of faults… I think. It came to me at that moment that I have no idea what a hard fault is, but it was the only thing out of the ordinary on the computer.
Hard faults are also known as page faults. Despite the negative connotation of the name, this is not an error condition. Rather, it represents an instance where a block of memory needed by the operating system or an application has to be fetched from the page file on the hard disk instead of from physical memory. A consistently high number of hard faults per second indicates a large—perhaps excessive—reliance on virtual memory, with consequent adverse performance effects.
So basically, it’s memory that I’ve likely asked for and the computer has gone: “No wait, we can’t actually provide that amount of memory from ram, we’ll fault to disk”. This was my first clue that it was memory related, but still I had no idea why this would be an issue, yes it probably generated a lot of garbage but it’s JavaScript…
So let’s dig into the code. The only api for updating the chart is a function called setData(data: number[]) which as you would guess, updates the entire
chart with the provided data. But that’s probably not that bad, since arrays are pass by reference in JavaScript.
These are the first few lines:
function setData(_data, _resetScales) { data = _data == null ? [] : copy(_data, fastIsObj);Yep, that’s exactly what you’d expect, it copies the entire array every time you update the data. I had looked around on the uPlot github and found this issue: implement .addData() API. It’s still open at the time of writing, apparently blocked by a chrome issue.
However, I was pretty sure my issue wasn’t related stroking performance, but memory. To quote my issue:
My use case had about 60 series on the chart, each being sampled at roughly 15hz and displaying at maximum the last 20 seconds of data. This results in a data set that is 15hz * 20s=300 points per series, with 60 series is 18,000 javascript numbers, at 64bits (8 bytes) per number, that means that I was trying to copy about 8 * 18,000=144,000bytes = 140kb every time the chart updated (I think my math is correct 😅) — Relevant Issue
To expand on those calculations. The chart stored a list of data growing, so if was I was sampling 60 series every sample that is $60 \times 8 = 480$ bytes. If we are sampling at 15hz then the data is growing at a rate of $15 \times 480 = 7,200$ bytes per second. However it’s actually way worse than that since it is copying the entire array on update, so it’s cumlative. Hence the number of bytes we copy grows. So after 20 seconds we would need to copy 144,000 bytes of data. This is bad algorithmic and has a fairly simple fix, only hand the data that the chart will show, so if we had it at 7 seconds of history, we only need to update 50,400 bytes every update.
That means I was likely generating about 50kb of garbage every second, since the whole old array gets thrown out. Updating that much data would make sense to slow down computers with slower ram, so I added a quick patch to just not copy the data. This made a big improvement!!! It’s all faster and life is happy.
Memory Copying
Guesses incoming
This is mostly just my posulations but, a modern computer should be able to allocate this much memory very easily, but what was likely hindering performance was the way the allocations were done. This is not just allocating that much per second, there would be a lot more different minor allocations. Furthermore, the GC passes would likely let the memory accumulate then destroy it. Noting it was performing worse on MacOS than Windows, but that system also had way more memory. These systems had either 16GB or 8GB of ram, so they could just be running out of ram plain and simple, this could massively exacerbate the performance issues, and aligns with the hard faults metric.
The rewrite
We rebuilt the entire site in Nuxt. For reference that chart was embedded in a client-side Vue application. Honestly, short review, it’s awesome, really enjoyed Nuxt. Used Nuxt UI, and it was faster than PrimeVue which we left behind. However, once this was basically entirely done, people were reporting that the new live chart is slower. This baffled me as it’s actually identical, and I couldn’t replicate it on my MacBook.
One more thing to know about the system, is that it sends out a heartbeat message, but when the live viewer gets overloaded, it fails to send out the heartbeat, and the other end of the pipe shuts off. This was observed in that it would just stop working.
I learnt on my previous optimisation journey, that allocation sampling is a very helpful metric. So I skipped straight to that, saw that half the allocated memory was on parsing the input data. Optimised that and bam! No improvements. Okay let’s step back, profile generally.
Look at that, isn’t that a crazy. Chrome shows no profile data for a whole pile of time. I found this term very hard to search for, this was the only relevant Stack Overflow post. Not having found that at the time, I looked into the recalculate styles.
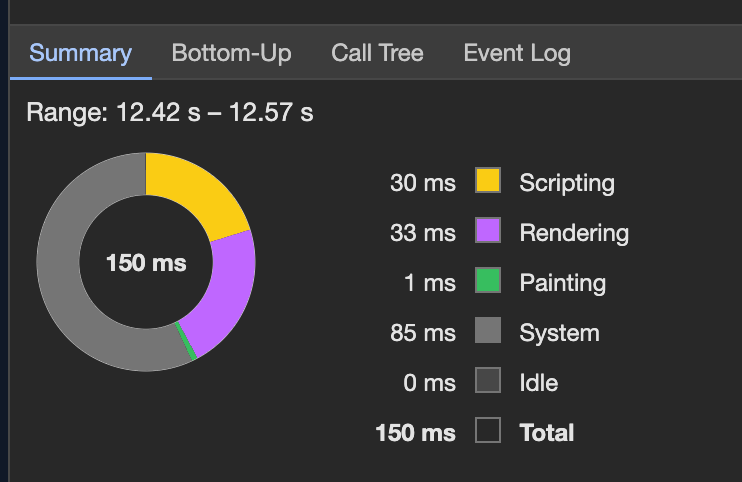
We can see that we’re getting three recalculate styles! We didn’t have that last time. We also see the system time is very high as was before.
So I assumed it was memory allocation still, but that makes little sense since the old code still works… So after looking into it more, the nodal depth of this new version was far deeper. Which would make the recalculate styles. Fixing this was fairly easy CSS fix, basically just make things have more fixed widths where possible. This massively improved the problem. So without clear proof, my guess is that the recalculate styles was triggering some form of context issue with the graph? Purely speculation.
Footnotes
-
I was shocked to see how many paid libraries there are for this, Lightning charts and high charts come to mind. Lightning charts looks tempting but high charts, insofar as I am aware is just an svg based library… (does any one pay for them??). ↩
-
it’s a bit slower in that example because Safari is not as fast as Chrome at canvas drawing. ↩